When we talk about an indicator of a company’s activity, the first one that comes to us is often the turnover. Indeed, tracking its sales is interesting but we will see that focusing on this indicator can be dangerous for a company.
Tracking the turnover
The turnover is a good indicator for measuring business activity. It represents all sales made. We also talk, for the industries, of production sold. It allows you to monitor the level of your income and thus monitor the growth of your business.
For this indicator to be relevant, you must regularly track the turnover level, usually on a monthly basis, and compare it to your forecast turnover. So, if there is a discrepancy, you will be able to act quickly and look for the causes of this difference.
Is your turnover lower than expected ? Look for the cause : lower selling price? Decrease in volumes sold ?
To make your forecast, you have two options. If you already have a data history, build on previous years and consider expected market developments and marketing strategy to make realistic sales forecasts. If your business is new or you’re launching a new product, look for market research. Analyze the figures of your competitors or companies that offer a product similar to yours and then take into account your sales capacity.
These turnover forecasts will be useful for you to realize your production budgets or your cash flow plan. You can also make three different forecasts: an optimist, a realist and a pessimist. Adjust and fine-tune your forecasts during the year to get the most reliable data possible.
A truncated view of the situation
A global turnover analysis gives you a truncated view of your company’s situation. We will see, using deliberately exaggerated fictitious cases, that the turnover must be analyzed in correlation with the margin and volumes sold.
The global turnover
A company decides to set up the monthly tracking of its turnover with a forecast. At the end of the year, here is the graph she gets.
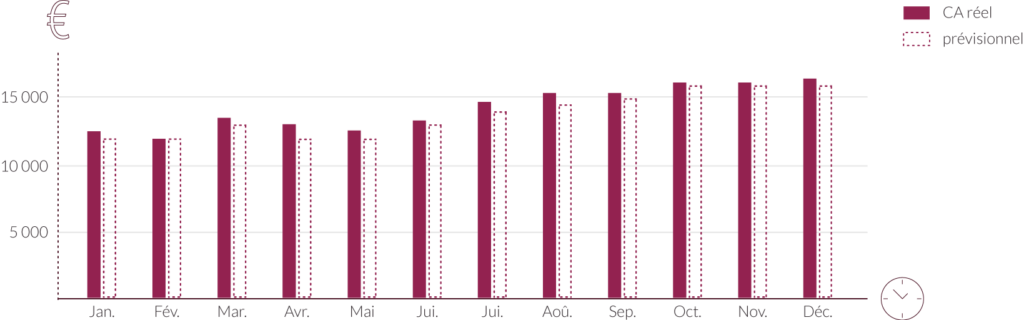
Changes in sales
At first glance, the company’s situation is healthy. Its revenues are up from the beginning of the year. Its turnover is sometimes much higher than expected. The leader could stop his analysis and continue on this path. Yet this graph hides an important problem.
The turnover Vs the margin
We notice that the company’s turnover increases significantly from June and then stabilizes after October. Let’s take a closer look at this period of growth and incorporate the margin on the graph.
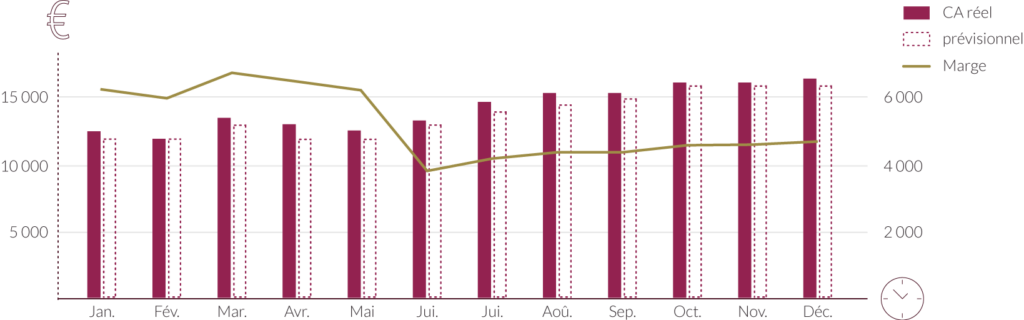
Changes in turnover and margin
While revenues increase, the margin drops drastically as early as June. What could be the cause ? One can imagine several scenarios :
- The company has decided to lower its selling prices to align itself with the competition, for example.
- Salespeople have been forced to lower their prices in order to achieve their turnover targets.
- From June, the company was forced to switch supplier with a higher cost of purchase.
This situation can go completely unnoticed when focusing solely on the turnover. However, it has an impact on the financial health of the company.
Product segmentation
Let’s take another example with a company that sells 2 products. On the first, it has a margin rate of 15%. On the second, its margin is much higher and reaches 50%. It is in the company’s best interest to analyze the structure of its turnover to ensure that the distribution of sales between the two products remains in line with its objectives.
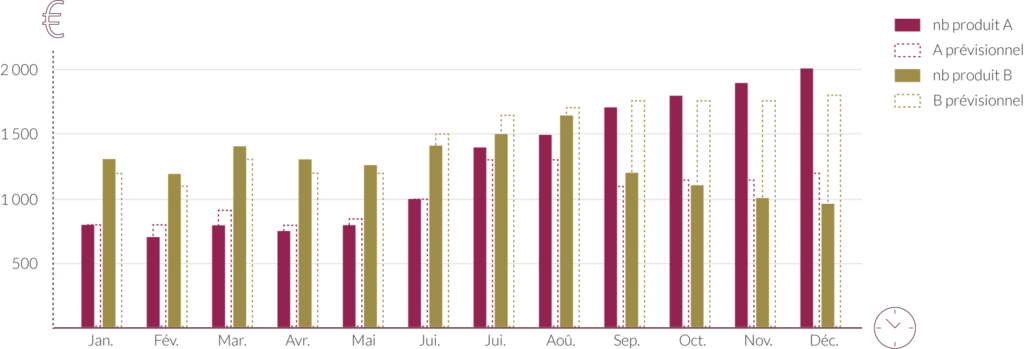
Turnovers by product by volume
In this graph of sales by product by volume, we note that in the second half of the year, the distribution gradually reversed. Sales of each product are no longer in keeping with forecasts. Low-margin product A has become a large majority. But let’s go further and look for the impact on the margin.
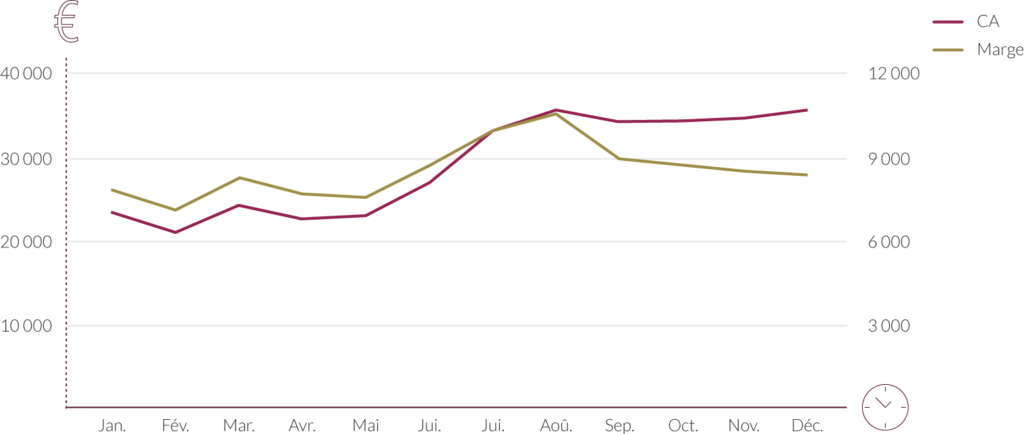
Changes in turnover and margin
First there was a slowdown and then a sharp decline in margin, while the global turnover was steadily increasing until December. The two curves intersect and follow two opposite trajectories.
The company is experiencing a strong growth in its turnover but it is at the expense of its profitability. Its sales were concentrated on its low-margin product, causing its overall margin to fall.
Is your margin led by an unprofitable product ? Ask yourself whether it’s in your range or adapt your marketing strategy.
As we can still see in this situation, the manager could miss out on a serious problem that jeopardizes the long-term viability of his company. By breaking down the turnover by products, it is possible to refine the analysis and react faster in case of deviation. The manager will be able to compare the evolution of each product or activity and act accordingly.
The turnover is therefore an important indicator to measure a company’s revenue growth. But he doesn’t tell you everything. It is essential to break down the overall turnover and link it to the margin achieved. In this way, you will be able to manage your company more serenely.