Inventory management is a crucial element for companies that can quickly cause some financial or structural problems when they are mismanaged. Let’s see together the value of putting in place an inventory tracking and some useful indicators to make your decisions.
A good inventory management saves you significant financial costs
A company may need to have stock, whether to deliver quickly its customers or save money by buying in large quantities or to anticipate a peak in activity. But the level of the stock must be managed carefully or risk incurring too much cost for several reasons.
Product expiry
When you sell products that have a limited shelf life, it’s in your best interest to manage your inventory so that you can sell your products before their expiration date. The classic example is the sale of food products. It is necessary to sell your products before their consumption deadline is reached. Otherwise, you suffer financial losses.
Unsellable products
Some products may become unsaleable due to a too long storage period. Imagine a product heavily subject to seasonality or a fashion effect. When the season has passed or when fashion has changed, you will have a hard time selling your product. Again, you risk losing money because of your stock.
Storage costs
The more products you have in stock, the higher your storage costs will increase. You will need more staff, additional warehouses, etc. To keep these costs down, a good inventory management will help you maintain the optimal level necessary for your business.
Manage your inventory to optimize your BFR
We mentioned this in our previous article on the BFR, stocks represent a sum of cash cash locked in your company. It’s cash that you haven’t cashed yet and that’s driving your BFR. The larger your stock, the more you increase your cash requirements to finance your business.
A good inventory management is about finding the right balance between customer service quality and stock level.
By effectively managing your inventory, you will be able to launch your next purchases at the right time. This prevents you from being en out of stock, which can cause the loss of some customers. But you also avoid being over-stock, which requires too much cash advance and can put you in financial difficulty to finance your business. The difficulty is to determine the optimum level that allows you to serve your customers properly without generating a surplus of stock and therefore expenses.
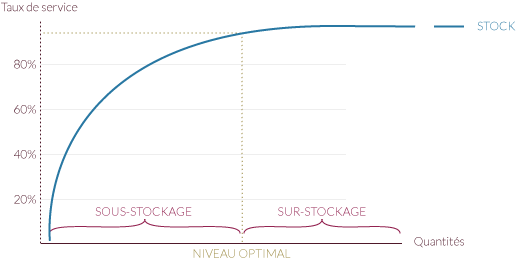
This graph shows us the ideal level of stock to achieve a given service rate. The service rate is the percentage of customer orders delivered on time. It therefore measures your ability to satisfy your customers. It is clear that from a certain level, the additional stock no longer provides any interest in the service rate. You’re over-storage.
The stock cost
Holding stock entails costs as we have seen before. But it’s crucial to determine exactly what your stock costs you.
There are several sources of costs:
Storage costs
These are all costs related to your storage buildings (rent, maintenance), your equipment (devil purchases, forklifts) and the personnel needed to manage your stock.
Financial costs
We talked about it with the BFR, your stock represents cash that could have been used elsewhere. You could have placed it and you would have collected interest. Or you could have invested in new production equipment, for example, and then hoped for an attractive return on investment. It costs you money to lock in that cash.
The depreciation of the stock
We’ve talked about it before. Your stock may deteriorate or be perishable. It may also become obsolete or unsellable. You then suffer losses that must be taken into account in the cost of storage.
Your stock not only costs you a storage fee but also represents cash that could have been invested or brought in interest.
By calculating the sum of all these costs, you get your storage cost and can act on a particular type of cost to optimize your costs. It is also possible to calculate your possession rate by making the ratio between your storage cost and the value of your stock. Let’s say your stock is worth €100,000 and your storage cost is $20,000. Your possession rate is 20%. With the possession rate, you can quickly see how much your stock costs you. In our example, the company knows that it has to provide 20% of the value of its stock to pay the various storage costs. A more mature company will even be able to calculate this rate of ownership for each type of goods or products stored, which will allow you to better control and refine your decision-making on your next orders. For example, a fresh food product will not have the same storage cost as a dry product.
Better manage your stock with a few indicators
Managing your stock level can sometimes become a real headache. Indeed, you must avoid over-storage that unnecessarily weighs on your level of available cash, but you must have a sufficient level to avoid the stock outage that will weigh on your commercial relations and your production.
To help you manage your stock, here are some indicators that will allow you to manage your business serenely.
Keep an eye on the stock’s turnover rate
The stock turnover rate represents the number of times your stock has been completely renewed over a period of time. For example, how many times your stock has turned in 1 year. The lower your ratio is and therefore closer to 1 and the longer your stock stays in your company and requires a lot of effort in terms of BFR. A high ratio will be evidence of good performance and good inventory management. To get this ratio, you first need to calculate your average stock over the period. Then, divide your sales by your average stock.
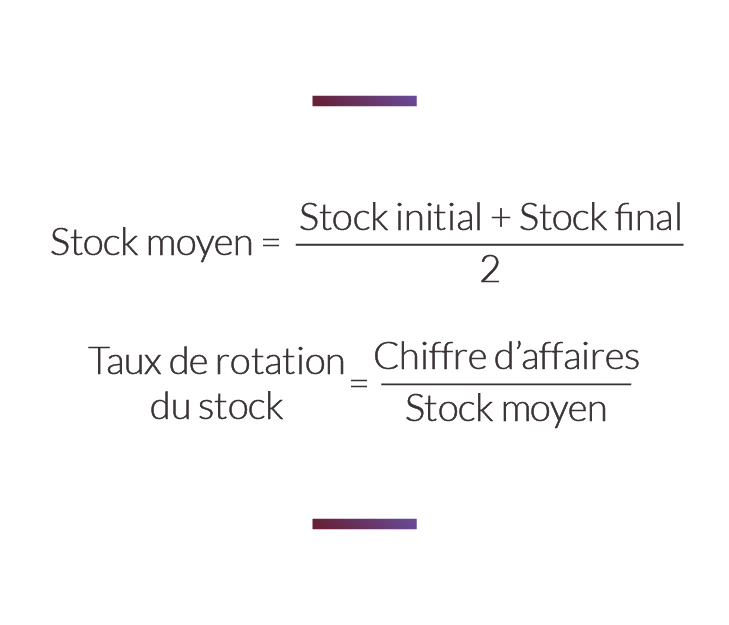
If your company has a turnover of 1,000K over one year and the average stock is 100K, you have a ratio of 10. You renewed your stock 10 times during the year. In other words, you managed to sell 10 times your stock in a year.
The length of time the stock runs out
From the previous items, you can also determine how many days it takes you to sell your stock. This is especially useful when you have food products that have an expiration date to meet. Or when your products have a fairly short lifespan. You should then check that you are able to sell your stock before your products are unsellable. Here’s how to calculate this indicator :
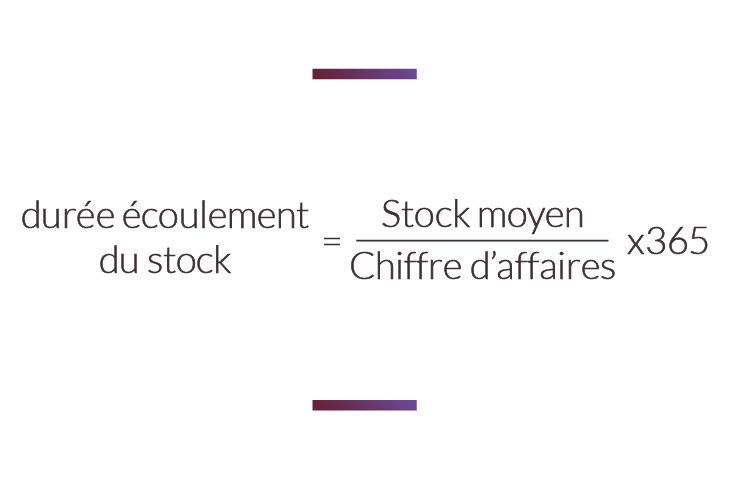
In our previous example, the duration of inventory runoff is 37 days.
Stock coverage
For the previous indicator, we were looking at how long the stock was sold out based on the turnover achieved. For this one, we rely on future forecasts of the turnovers to check how many days of activity you can cover with your current stock. This indicator allows you to manage your stock level to avoid break-ups. Indeed, a number of days of too few coverage puts you in a difficult position in case of an unforeseen large order. Here’s how to get stock coverage:
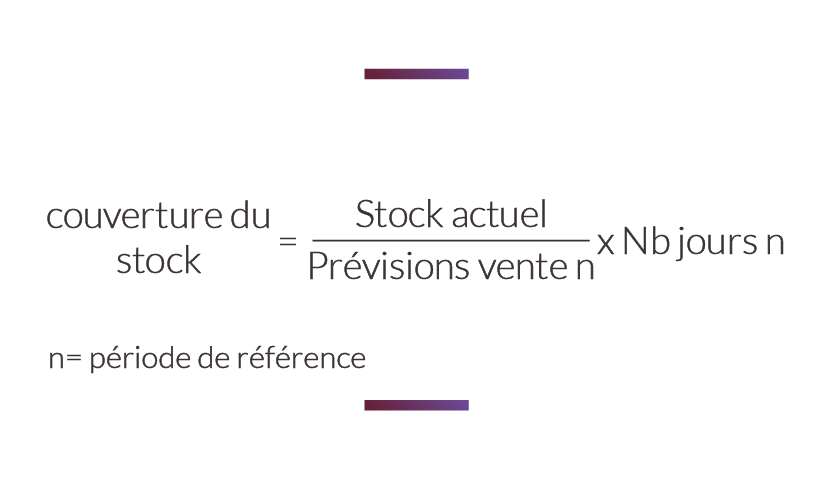
Let’s say your company has a stock of 100K. Your sales forecast for the next 6 months is 1,000K. You have 18 days of coverage. You can insure scheduled orders for 18 days with your stock before you run out.
Place your orders at the right time
We have seen that there is an optimal level of stock that should not be exceeded in order to avoid unnecessary financial costs. Conversely, a too low stock will not allow you to honor all the orders on time. So, you have to juggle these two data to plan your replenishment orders. Your goal is not to fall below a certain minimum threshold below which you risk disruption or a too low service rate. This stock is called the security stock. But, when you place an order, you are rarely delivered the same day. So, you need to consider delivery times to determine the level of stock at which you need to start a replenishment. This will be your order point.
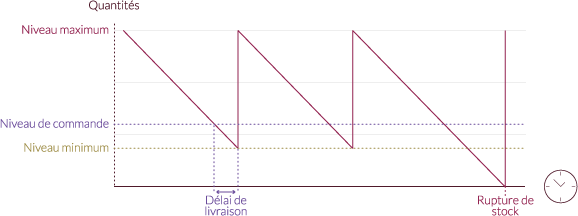
This graph shows the rotation of a stock within a company. When the company arrives at the order point, it buys from its suppliers. The stock then continues to decline until delivery brings the stock to its maximum level. If all goes well, the company remains able to fulfill the orders of its customers. But a supplier defect or delivery delay can stop the system and then cause a stock outage as shown in the graph. So, you need to be responsive and keep an eye on your various indicators to effectively control your business. Of course, your inventory management is largely dependent on sales forecasts and the distribution planning in your company. It is necessary to have a global view of your business in order to effectively manage your stocks.